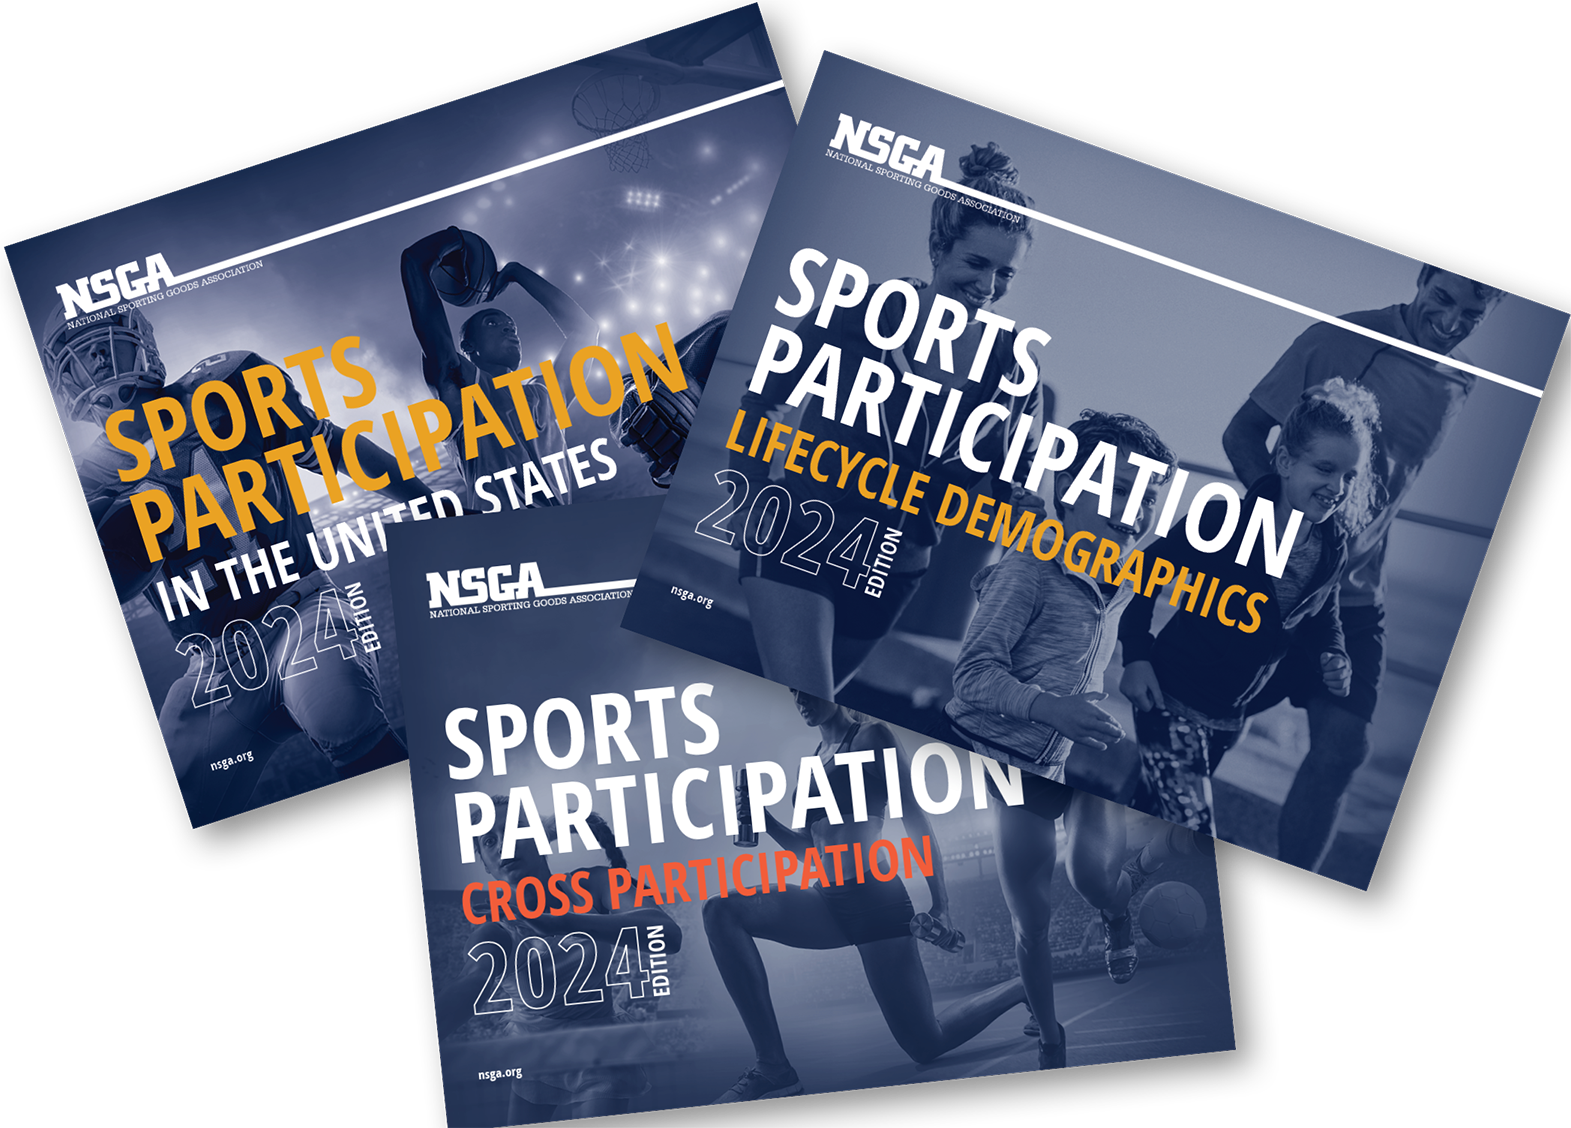
Sports Participation in the US – 2024 Edition
NSGA’s highly successful Sports Participation study has been executed for 40 years. Conducted in 2024, the study measures the annual number of participants in a variety of sports / recreational activities and the frequency of participation during the calendar year 2023.
The report contains two sections, giving the reader a comprehensive picture of sports participation in the United States:
Section One delivers snapshots for a quick view of participation of any sport or activity included in the study. The snapshots include: 10 year participation information (when available), 2023 frequency and participation by age, household income, and US region.
Section Two furnishes detailed tables providing participation information regarding: gender, age, education, presence of children in household, household income, market size, US region, ethnicity/race, and frequency of participation.
Sports Participation Cross Participation – 2024 Edition
Sports Participation: Cross Participation provides detailed data identifying sports/recreational activities participated in by the same individual.
How can Cross Participation be used?
- Assist decision-makers to maximize retail space and determine which product categories should be adjacent to each other within the retail store
- Identify cross promotional opportunities
- Generate new business opportunities from existing products and customers
- Optimize the positioning of secondary locations to generate impulse sales
Sports Participation Lifecycle Demographics – 2024 Edition
Sports Participation: Lifecycle Demographics classifies households in terms of several demographic characteristics and defines them in broad socioeconomic terms, providing a tool which can help understand consumer behavior. The report includes the following 8 lifecycle segments:
- High Income Singles
- Low/Middle Income Singles
- Young Adult Households
- High Income Households
- Low/Middle Income Families
- High Income Middle Aged Households
- Low Income Middle Aged Households
- Seniors
How can Lifecycle Demographics be used?
Use demographic research to develop analytics and fact-based business planning including demographic-specific marketing and product mix
Sports Included
- Archery (Target)
- Backpack/Wilderness Camping
- Baseball
- Basketball
- Bicycle Riding
- Billiards/Pool
- Boating (Motor/Power)
- Bowling
- Boxing
- Camping (Vacation/Overnight)
- Canoeing
- Cheerleading
- Dart Throwing
- Exercise Walking
- Exercising with Equipment
- Fishing (Fresh Water)
- Fishing (Salt Water)
- Football (Flag)
- Football (Tackle)
- Football (Touch)
- Golf
- Gymnastics
- Hiking
- Hockey (Ice)
- Hunting with Bow & Arrow
- Hunting with Firearms
- Ice/Figure Skating
- In-Line Roller Skating
- Kayaking
- Lacrosse
- Martial Arts/MMA/Tae Kwon Do
- Mountain Biking (Off Road)
- Muzzleloading
- Paintball Games
- Pickleball
- Pilates
- Running/Jogging
- Scuba Diving (Open Water)
- Skateboarding
- Skiing (Alpine)
- Skiing (Cross Country)
- Snowboarding
- Soccer
- Softball
- Surfing
- Swimming
- Table Tennis
- Target Shooting (Airgun)
- Target Shooting (Live Ammunition)
- Tennis
- Volleyball
- Water Skiing
- Weight Lifting
- Work Out at Club/Gym/Fitness Studio
- Wrestling
- Yoga
PLEASE NOTE: Cross Participation data is not available for the following sports: archery (target), cheerleading, gymnastics, hockey (ice), hunting with bow & arrow, in-line roller skating, lacrosse, martial arts/MMA/Tae Kwon Do, muzzleloading, paintball games, scuba diving (open water), skiing (alpine), skiing (cross country), snowboarding, surfing, target shooting (airgun), water skiing and wrestling.
Lifestyle Demographic data is not available for the following sports: cheerleading, muzzleloading, pickleball, scuba (open water), skiing (cross country) and surfing.
If you have questions about this report or would like help finding the right report for you, please contact Nick Rigitano, NSGA Director of Insights and Analysis, at (847) 296-NSGA (6742), ext. 1080 or nrigitano@nsga.org.


 Back to
Research Offerings


