 Back
to News
Back
to News

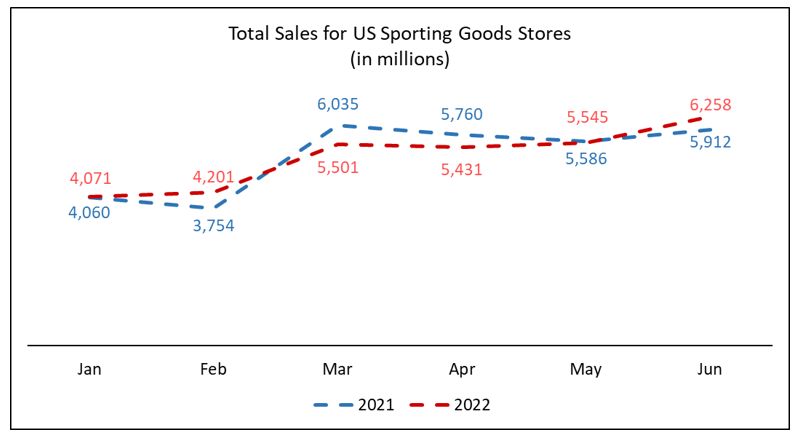
According to the US Census Bureau’s Monthly Retail Trade Report, sales for sporting goods stores during the month of June 2022 reached $6.26 billion, representing an increase of 5.9 percent versus the prior year. Information for July will be available next month.
Important side note: You may have already seen what appears to be a similar figure being reported by other organizations for the month of July and may be wondering, “why is NSGA one month behind in their reporting?” Please note the figure currently being reported for July is for the category of Sporting Goods, Hobby, Musical Instruments and Book Stores. In effort to provide you with the most accurate data possible, NSGA waits until the data for Sporting Goods Stores ONLY is separated out and released by the US Census before reporting it.